
If you’ve been doing a whole-food, plant-based diet for more than 15 minutes, then a family member, friend, relative, colleague, or total stranger has probably asked you, “Where do you get your protein?” Arrggh, right?!? According to Doug Lisle, Ph.D., “This is not a question. This is the beginning of an argument.” Much has already been written and said about how to respond – and I’ll defer to others. But, perhaps you haven’t had time to study some of the data, up close and personal.
Fortunately, Jeff Novick recently published a useful table of 73 common plant foods and some of their associated attributes. He included an attribute that we’ll call protein density (PD), the protein content (in grams) contained in one pound of any given food. If you’re like me, you can absorb this type of information much more readily in graphical form than as a table of numbers.
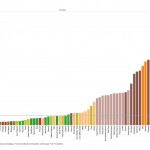
Protein Density for Individual Food Items
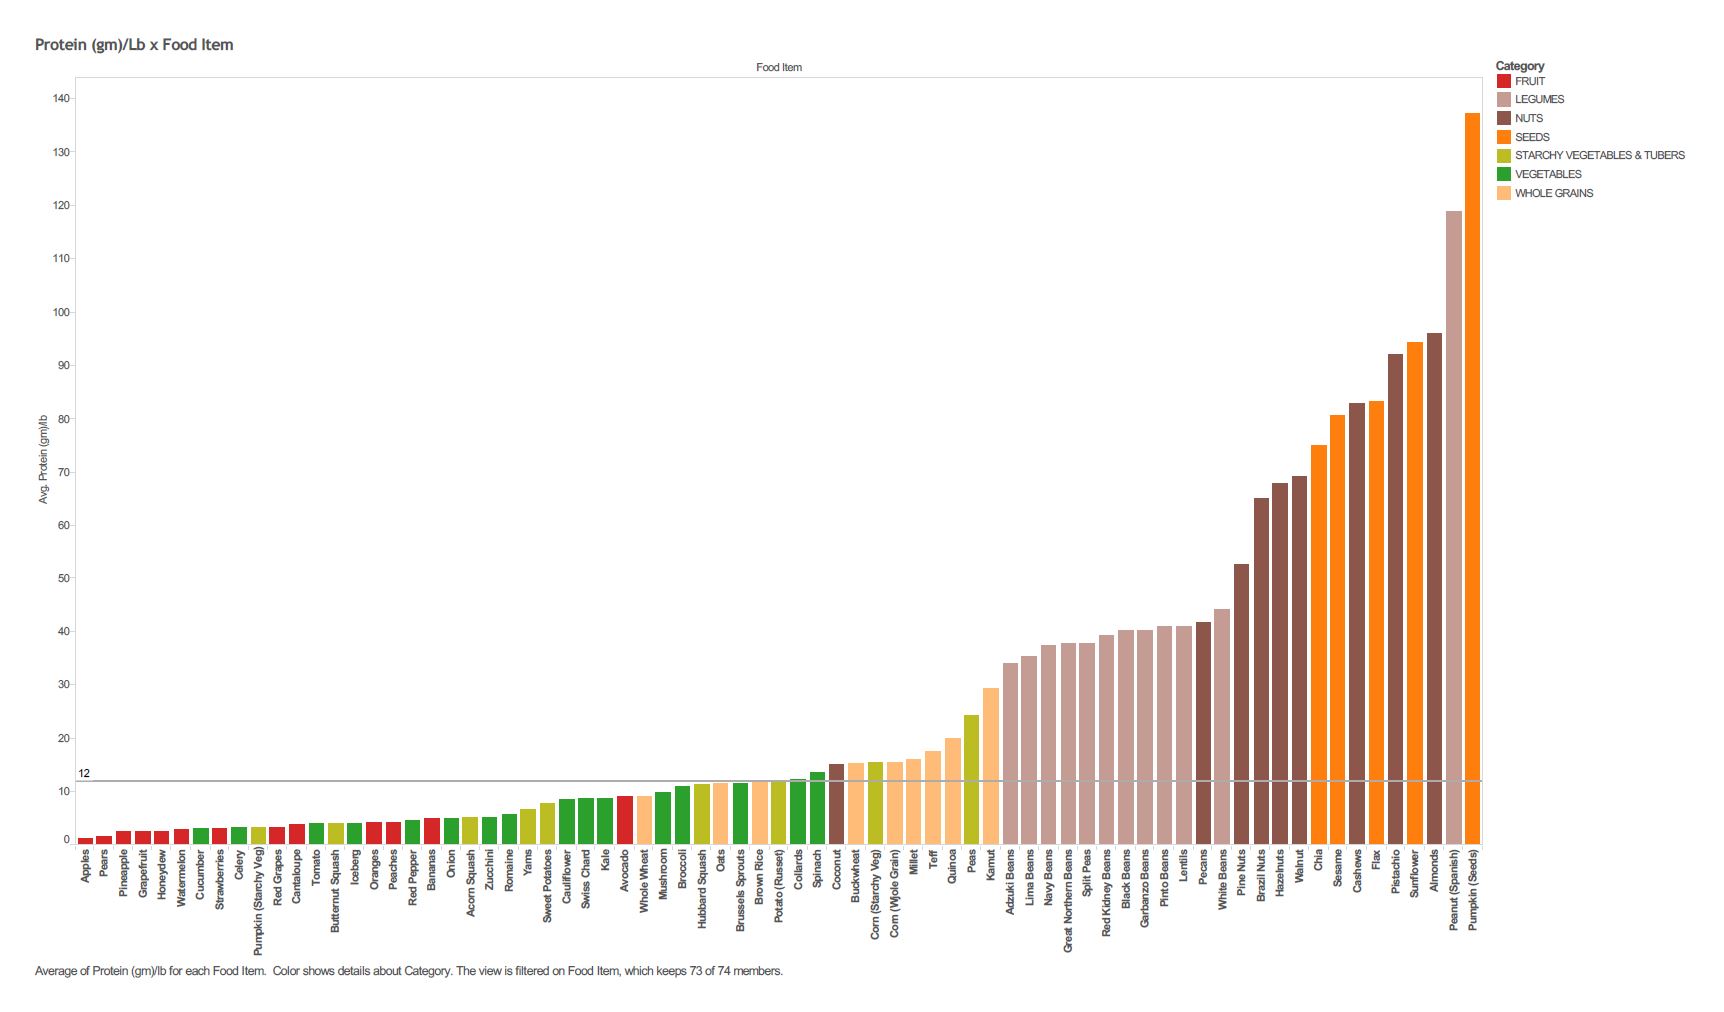
Figure 1 – Protein Density for Common Plant Foods. Click the image for an enlarged view
Figure 1 displays all of the PD data from Jeff Novick’s table in a single view. (Be sure to click on the Figure to get the expanded version). Each bar in the chart stands for a different food item, such as apples, broccoli, or peas. The bar height represents the protein density of the item – the taller the bar, the greater the protein density. The color of the bar indicates the category, or food group, of the item (for example, categories include fruits, whole grains, and nuts). I attempted to make the colors memorable: vegetables are green (like spinach), fruits are red (like an apple), whole grains are tan (like bread), etc. Finally, the foods are sorted left to right, starting with the lowest PD foods on the left, progressing to the highest PD foods on the right.
What big features do you notice immediately in the chart? Perhaps the entire views reminds you of a geographic cross-section:
- Your journey begins on the left in the low-lying green valley of fruits, vegetables, and starchy vegetables.
- Moving to the right, you ascend through the whole grain “plain”, and then begin a steep climb into the plateau of legumes.
- Forging ahead, you encounter the steep, mountainous terrain of the nuts and seeds.
Along the way, stop to savor some individual plant foods. Which ones capture your interest? For instance:
- The avocado is a high-PD fruit, weighing in at 9.1 grams of protein per pound (gm/lb) – more than double its fruity peers.
- The coconut is a low-PD nut at 15.1 gm/lb, much more akin to a whole grain.
- A peanut is a high-PD legume. At 118 gm/lb, it is the second-highest PD food in the sample.
This is great stuff, isn’t it?! But can we simplify the picture even more?
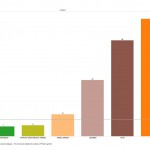
Protein Density for Food Categories
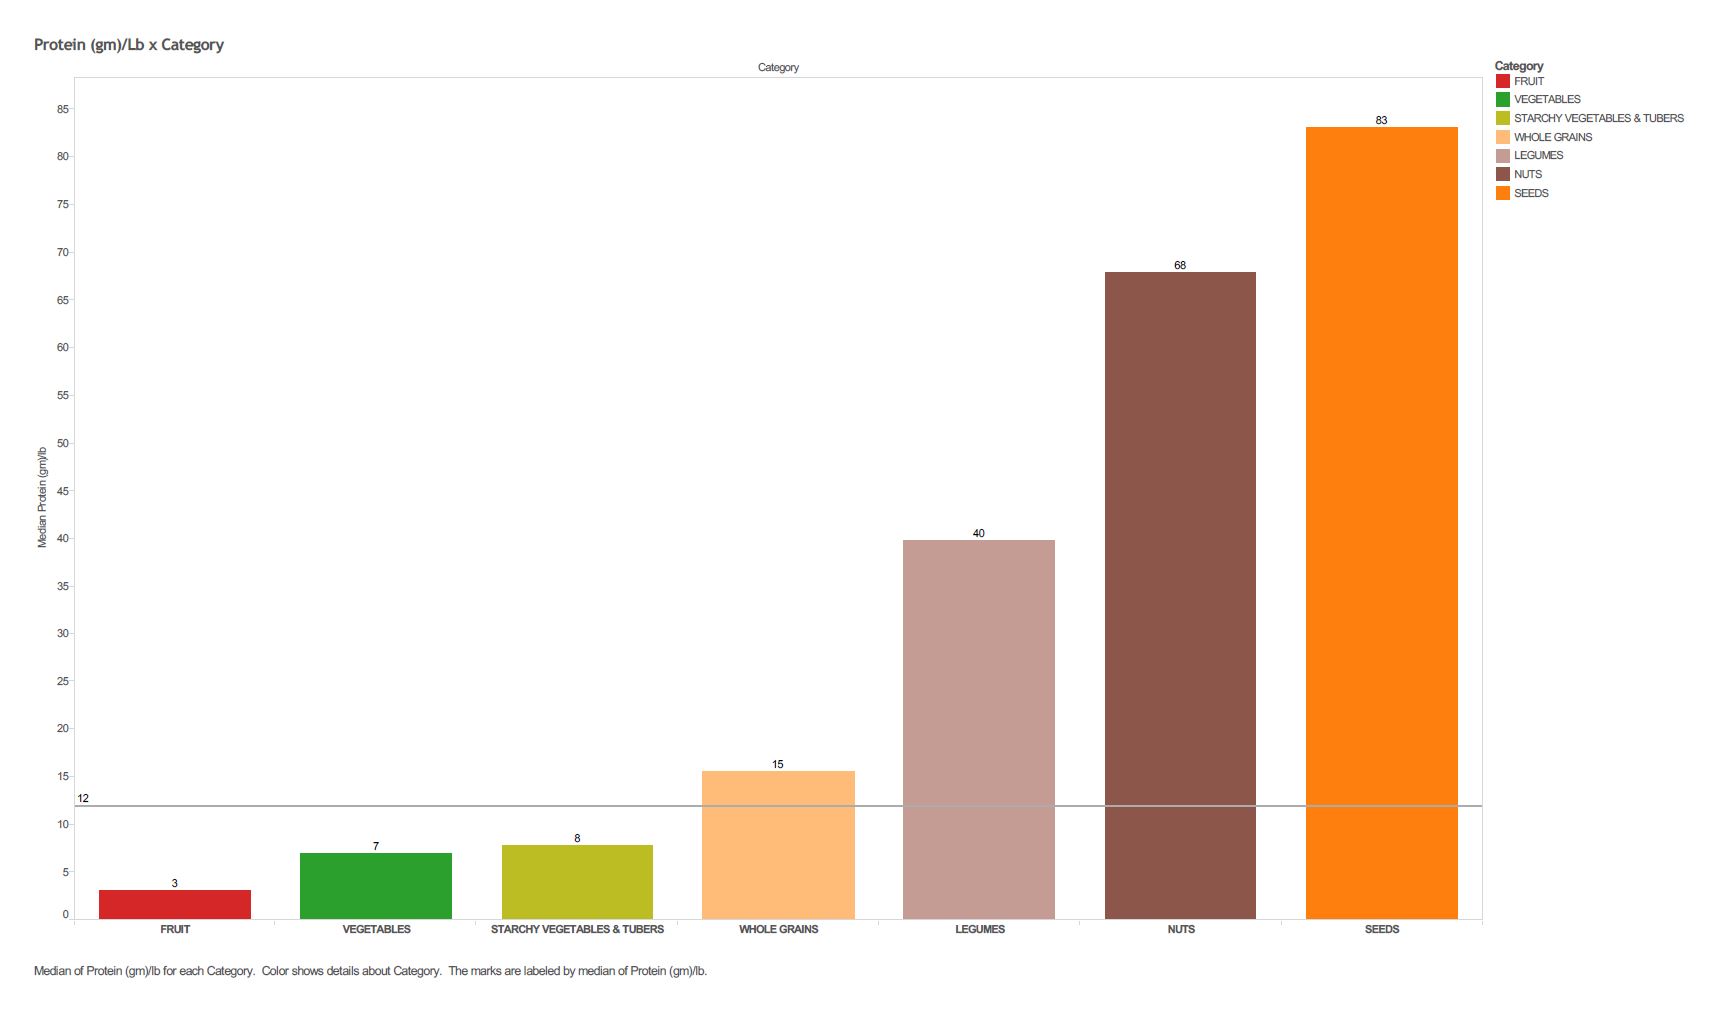
Figure 2 – Median Protein Density for the Common Plant Foods Categories. Click the image for an enlarged view
Yes, we can! Previously, we used the food categories to color the bars in Figure 1. But we can also use them to condense the 73 food items into 7 numbers, one for each category, as shown in Figure 2. Here, each bar is a different category (fruit, vegetable, legume, etc.). The bar height indicates the typical PD of the foods belonging to that category. [Technical Note: For the typical PD value, we used the median of the category. The median is a good, representative value, and it isn’t skewed by unusual, outlying items – like avocados or peanuts – the way an average value is]. The colors of the bars and their sorting are the same as used in Figure 1 for the individual food items.
This category view clarifies the “big picture” that was only vaguely apparent in Figure 1. Most striking to me is the wide range of protein densities. The typical vegetable is twice as protein dense as the typical fruit, and the typical whole grain is twice as protein dense as the typical vegetable. Legumes as a category are twice as protein dense as whole grains, and seeds are twice as dense as legumes. Altogether, that’s 4 doublings!! Or, viewed another way, the typical seed is 27 times more protein dense than the typical fruit. That’s some wide variation – which is great for you and me as a whole-food, plant-based eaters! We can get plenty of protein in many delicious whole-food packages.
Is There a Problem?
The recommended daily intake of protein is 46 grams for women and 56 grams for men[1]. Let’s say 50 grams for easy ciphering. And let’s suppose that you typically eat 4 lbs of food every day. [Estimates vary for the daily amount of food that the average person eats, but it’s somewhere between 3 and 5 pounds. Your mileage may vary. But the important point is that you do consistently eat the about the same weight of food each day]. By applying division, multiplication’s tricky pal, you find that an average daily protein density of about 12 gm/lb (50 gms/4lbs) will satisfy your needs. (Each of the charts above has a handy reference line at 12 gm/lb for your convenience). From the charts above, it seems clear that you can easily get adequate protein from a balanced whole-food, plant-based diet – without the need for any careful planning, weighing, or measuring. I think that’s why authorities like Dr. John McDougall say, “Protein deficiency is impossible, even on a vegan diet.” A quote I like even better comes from Doug Lisle. He says, “You don’t need to have your doctor check your protein level. If you can walk in the door for your next appointment, you have enough protein.”
[1] These figures come from the Center for Disease Control. They also match the values from the World Health Organization for a 122 lb. woman and a 150 lb. man.
 (1 votes, average: 5.00 out of 5)